Analytics
Library → Analytics projects your data into charts, maps, and a 2D embedding graph. Read-only — Analytics is for understanding your corpus, not editing it.
It used to be its own page
Analytics was a top-level Insights page. It now lives as a tab inside
Library, because it describes your library and belongs beside it. Old
#/insights?tab=… links still work — they redirect to the matching
Analytics section.
Analytics is what you read; Health is what you fix
The old Diagnostics tab is gone. Its operational half — failed background operations, quality scorecards, recent refreshes — moved to the Health page's Activity tab, next to the repairs it explains. Its five passive trend charts were deleted rather than moved: they plotted history nobody acted on. Rule of thumb: a chart you read → Analytics; something wrong you fix → Health.
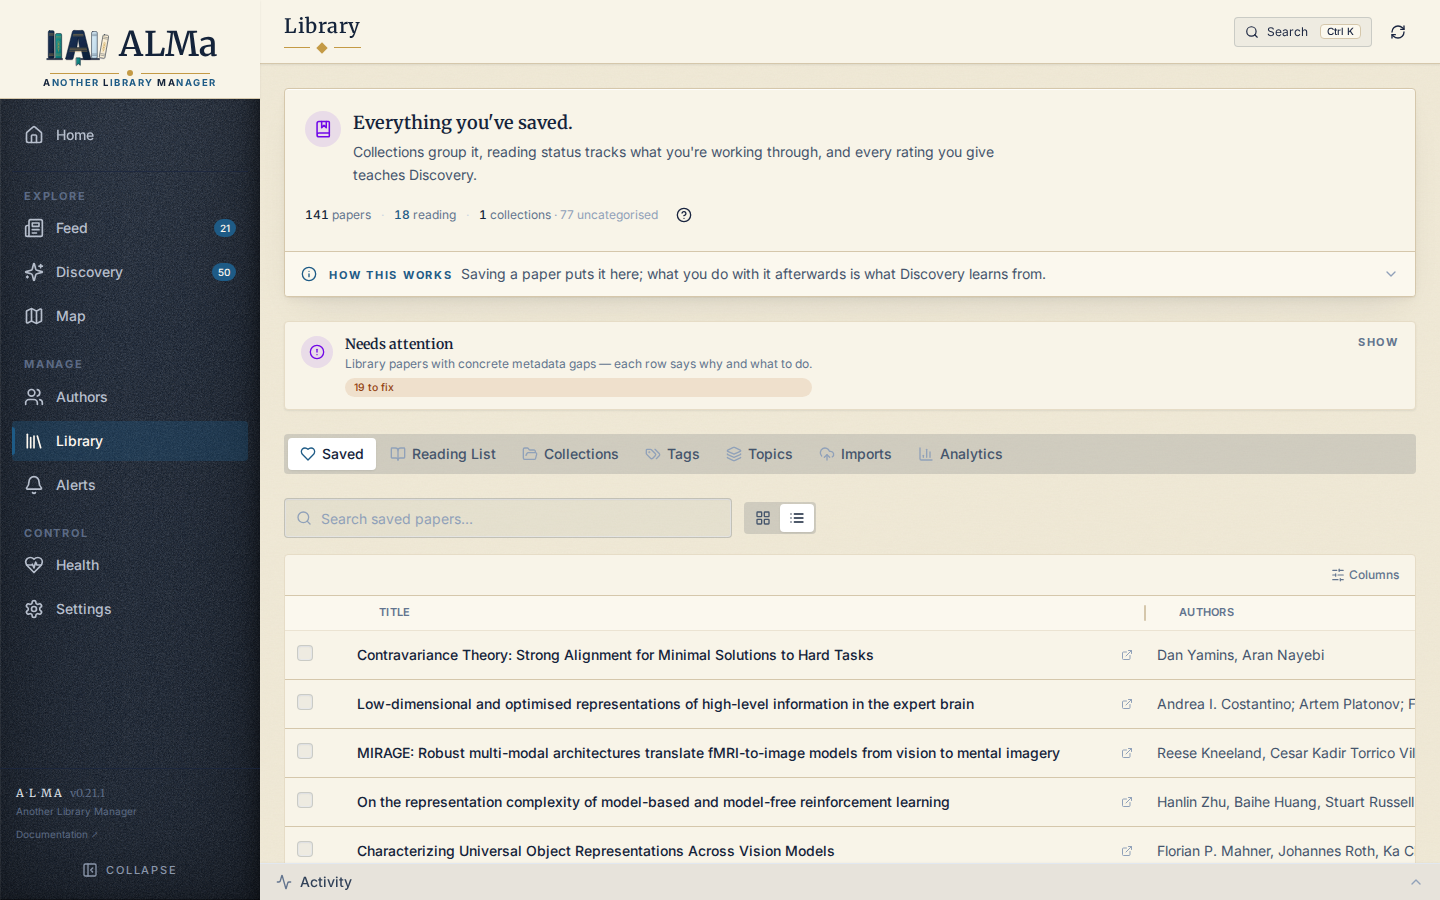
Tabs
Overview
The default section. Aggregated metrics:
- Summary — total papers, total followed authors, total collections, total tags.
- Publications timeline — bars for volume, plus a median citations line. Median is the default because one runaway paper drags a year's mean far from where its papers actually sit; the mean is one toggle away, dashed. Dots above a bar mark that year's papers in your library-wide top citation decile (a paper must exceed the 90th percentile, not merely equal it). Hovering a year names its most-cited paper; clicking drills into that year, citations first.
- Your topics — clusters of your library, labelled by the c-TF-IDF terms that distinguish them. See the note below.
- Top journals — a ranked list you can act on: each row drills into its papers and can be followed on the spot, using the same follow state as the paper cards. Journals with 3+ saved papers show a quiet "Follow?" hint.
- Provenance — where the work came from, with a Countries / Institutions switch (one question, two zoom levels, one card).
- Authors rail — the most-published / most-cited authors in your Library, with paper counts and h-index.
- Recommendations engagement — Discovery-side stats: total recs surfaced, seen, liked (positive action), dismissed, plus engagement rate.
- Library — total saved, average rating, total collections, total followed authors.
All Overview blocks are Library-scoped — they reflect the saved corpus, not the entire tracked set.
Your topics are yours, not a global taxonomy
This card used to show OpenAlex's subject taxonomy applied to your papers. It now shows how your library actually groups: the clusters computed from your SPECTER2 embeddings, each labelled by the terms that distinguish it. Those answer different questions, so the taxonomy no longer stands in for it — if embeddings aren't computed yet the card says so and points at Settings → AI rather than silently falling back. OpenAlex topics remain visible inside individual paper rows.
Graph
A 2D projection of your Library's SPECTER2 vectors. Requires that
embeddings have been computed (either pulled from Semantic Scholar
or generated locally). When no embeddings are available the page
falls back to a principled text-TF-IDF clustering on title +
abstract; it never clusters on publication_topics (OpenAlex's
coarse topic vocabulary), journal, or author names.
Pipeline (BERTopic recipe)
SPECTER2 vectors (768-d)
│
├─▶ L2-normalise rows (cosine geometry — what SPECTER2 was trained for)
│
├─▶ UMAP n_components=5 (cosine, n_neighbors=15) ── clustering substrate
│ │
│ └─▶ HDBSCAN(metric='euclidean', leaf) ── density clusters
│
└─▶ UMAP n_components=2 (cosine) ── 2-d display layout
L2-normalising puts every vector on the unit sphere, so euclidean on the reduced space is rank-equivalent to cosine in the original 768-d space — letting HDBSCAN/UMAP/kmeans use their fast euclidean code paths without leaving the geometry SPECTER2 was trained for. UMAP-reducing to 5-d before HDBSCAN solves the curse of dimensionality: density estimates are unreliable in 768-d at our scale (50–500 papers) but tractable at 5-d. Both the clustering substrate and the display layout read the same L2-normalised input through cosine UMAP, so visual proximity and cluster boundaries agree by construction — neighbouring papers in the layout are also in the same cluster.
Behaviour
- Auto-k clustering — HDBSCAN with
cluster_selection_method='leaf'picks the cluster count automatically; no fiddling withk.min_cluster_size = max(3, min(12, ⌈√n × 0.5⌉))so a 50-paper library produces 5–8 well-balanced clusters and a 300-paper library produces 15–25. - Distinctive cluster labels — class-based TF-IDF (the BERTopic c-TF-IDF formula) over (1, 2)-grams of each cluster's member titles
- abstracts. An English + academic-domain stop-list (
study,method,result, …) is removed before scoring, and a bigram absorbs its constituent unigrams in the final phrase so labels read as topics ("visual cortex, object recognition") rather than bag-of-keywords. Labels persist ingraph_cluster_labelskeyed by the cluster's member-set signature; the Refresh cluster labels job recomputes them in the background and pushes the result through the same materialised-view layer. - Hover detail — paper title, year, journal, rating.
Graph data is cached server-side via the materialised-view layer (fingerprint-keyed, see Performance). Re-clustering is opt-in via Settings → Operational status → Rebuild graphs.
Fallbacks
- UMAP unavailable / N < 15 → cluster on the L2-normalised raw vectors with HDBSCAN. Same geometry, just no dimensionality reduction.
- HDBSCAN unavailable → silhouette-driven
MiniBatchKMeanswithk ∈ [2, 30]on the reduced space. - HDBSCAN collapses to ≤ 3 clusters on N ≥ 18 → same kmeans rescue so the paper map is never reduced to a few mega-clusters.
- No embeddings at all → text-TF-IDF clustering on title +
abstract. Never
publication_topics, never journal/authors as topical features. Falls back to an unclustered grid when text is too sparse.
Reports
Time-window summaries:
- Weekly brief — what was added, what shifted, what surfaced.
- Topic drift — how topic mix changes over time.
- Signal impact — which ranking signals correlate with useful outcomes.
Collection intelligence moved to the bottom of Library → Collections, beside the collections it describes. It still generates on demand.
How fresh is what I'm seeing?
Charts (Overview / Reports) are served from a fingerprint-keyed cache: each GET returns the previously-computed payload in <10 ms; when your data changes, the next page load serves the previous snapshot while a background job rebuilds it, then swaps silently. The Refreshing… pill in the header lights up during that window.
Maps (Paper Map / Author Map) follow a stricter contract: the 2-D layout is a durable artifact — ONE corpus-scope "substrate" (positions + clusters + labels), computed only by background jobs, never during a page load. Opening the map is a pure read of the stored payload (fast at any corpus size). Freshness is owned by the graph layout maintenance job (every 6 h, idle-gated):
- a paper that gains a vector is placed incrementally at its nearest cluster centroid, usually within minutes of the vector arriving — no re-layout;
- a full re-layout happens only when the embedding set drifts ≥20 %, the algorithm/model version changes, or the layout is a week old.
The map header shows when the layout was built and how many new papers await the next fold-in. The Library map is a filter of the corpus substrate — there is no second layout, so the two views can never disagree about where a paper sits.
Both maps also read membership on the same three channels: a filled dot is yours (a saved paper; an author you follow or have saved a paper from), a hollow dot is being suggested to you, and a faint dot is context. One common space, so "who is mine and who is new" reads identically wherever you meet it. Anything that cannot be placed is never faked into position: an author needs at least two papers already placed on the corpus substrate, so the Author Map omits thinner profiles and says how many in the legend. To force a fresh layout right now, the Rebuild graphs button still works; custom knob combinations (a different cluster detail, a fused layout) build in the background too — the map shows "Building this view…" and appears automatically when ready.
Activity panel
Not part of Analytics, but always docked at the bottom of the screen on every page:
- Operations tab — running and completed background jobs with progress, per-source timing, and a Cancel button on long-running jobs.
- Logs tab — real-time application logs filtered by level
(
ERROR / WARNING / INFO / DEBUG).
The Activity panel is where the observable system principle actually lives. Every meaningful operation has a job envelope here; if it doesn't, that's a bug.
API
GET /api/v1/insights # full overview (Stats)
GET /api/v1/graphs/paper-map # Graph (paper map)
GET /api/v1/reports/weekly-brief
GET /api/v1/reports/collection-intelligence
GET /api/v1/reports/topic-drift
GET /api/v1/reports/signal-impact
The diagnostics endpoints (/insights/diagnostics/sections/{section}) power
the Activity tab. Their operational section also feeds the
Health page's System status cards (the actionable operational view).